그러나 Eclipse에서는 기본 console에선 이런 기능이 없다.
그래서 이 로그를 쉽게 보기 위해서 아래 플러그인을 넣으면 된다고 한다.
테스트 해보고...
During the development process, it is common for developers to print log output on the console. Typically, the developer will also customize the format of the log output by setting properties of a PatternLayout instance. The Logback Console Plugin for Eclipse serves the same purpose as the regular console, but offers several advantages over the plain-old console. Below is a list of key advantages of our plugin:
- Event of level WARN and ERROR are colored in orange and respectively in red.
- Go to the java class and line where any given logging request was issued by double-clicking on its output line.
- Filter events with logback's powerful filtering mechanism without changing your logging configuration.
- Change the output format dynamically whenever you chose to do so.
- Easy configuration (only one line in your logback.xml file).
Installation
Installing the plugin requires a few steps. First get the plugin from our download page.
Once the transfert is complete, unzip the file called ch.qos.logback.eclipse_VERSION.zip. Place the folder found inside the archive in the following directory: ECLIPSE_INSTALL/plugins/ where ECLIPSE_INSTALL is the directory where you've installed Eclipse.
Relaunching Eclipse should load the plugin. To access the logback plugin, open the following menu: Window > Show view > Other... . You should see the Logback View nested in the Logback category. Selecting the view will add it to your workspace.
Logging to the logback plugin
Logging to the logback plugin takes a single line of configuration in your logback.xml configuration file, as you can see below.
<?xml version="1.0" encoding="UTF-8"?>

<configuration>

  <consolePlugin />

</configuration>
This element will trigger the creation of a SocketAppender that will send events to the localhost, on port 4321 by default. That's all it takes to run your software and log to the logback plugin. By default, logging events are not filtered, but please keep in mind that context-wide filtering in your logging configuration may affect the events that are recieved by the logback plugin.
If you already have a server running on the default port, you can specify the port that will be used by adding a simple attribute to the xml element:
<?xml version="1.0" encoding="UTF-8"?>

<configuration>

  <consolePlugin port="4567" />

</configuration>
In that case, however, you will need to specify in the plugin preferences on which port to listen for events. The plugin preferences will be covered in a following section of this document.
Using the logback plugin
Once the Logback View is shown on your workspace, you might want to configure it to fit your needs. Look at the right side of the plugin view. You should see two buttons, along with the usual three Eclipse icons:

The first button on the left clears the console. The second button toggles the auto-scroll functionnality. When enabled, you will always see the latest logs that have been recieved by the plugin. If you disable the auto scrolling, the view will display the current logs, and add the new ones at the bottom of the list.
The third button opens a sub-menu that lets you configure the logback plugin. This will be covered in a short moment.
When your software logs events, they are displayed in the logback view as shown below:
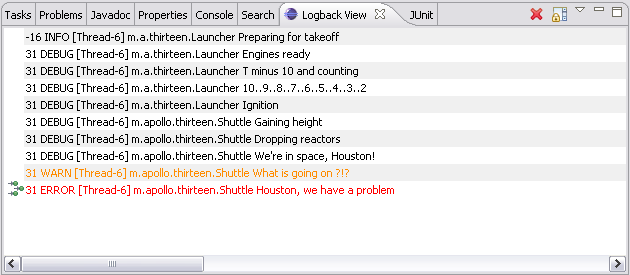
All events with the WARN level are displayed in orange. ERROR level events are displayed in red.
Double-clicking on a log entry will open a Java editor and show you the line where the entry was requested. It is an easy way to be access directly to the class and method that logged the selected entry.
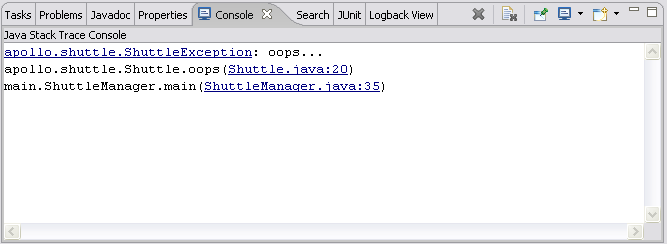
When an icon is shown on the left of the logging event, it means that the logging event contains a stacktrace. Right-clicking on the line reveals a sub-menu that lets you open Eclipse's StackTrace Console and display the stacktrace. You can click on the underlined parts of the stack trace to open an editor revealing the selected class.
Configuring the logback plugin
On the right of the view, right next to the auto-scroll toggle is a button that opens a sub menu.
Preferences
The first item in this menu opens the plugin's preference window.
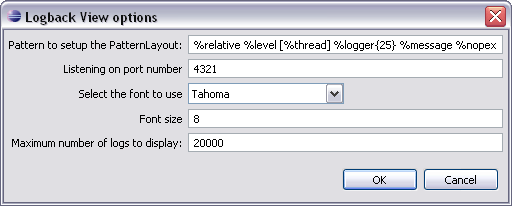
In this window, you can configure the pattern that will be used by the plugin to display the logs. By default, it is configured to show the following informations:
- Relative time since launch
- Level of the request
- The thread name
- Name of the logger. The name is automatically shortened when longer than 25 characters
- The message of the request
An important point about this pattern is that, if it is modified, the changes are immediately reflected on the current content of the logback view. That means that if you would like to display an MDC value, or any other information that the PatternLayout provides, you can change it even after the logs have been requested.
Along with the pattern, you can specify the port on which the plugin will listen for logging events. You can also choose the font type and size that will be used to display the logs in the logback view.
Finally, you can choose how many logging events should be displayed in the view before the list is trimmed. By default, the logback plugin will display 20'000 events. Once this number is reached, the plugin automatically drops the 30% oldest logs. Please note that changing this value to a too much higher value might lead to memory issues, or even crashing Eclipse.
Filters
The logback plugin lets you filter logging events when they are recieved. It uses the powerfull EvaluatorFilterobjects that are available in logback. For detailled information about these filters, you might want to check the corresponding documentation in the logback manual. In this document, we will only cover some basic points, enough to get you started using the filtering functionnality of the logback plugin.
The second item of the sub-menu on the right of the logback view opens the filter configuration window:
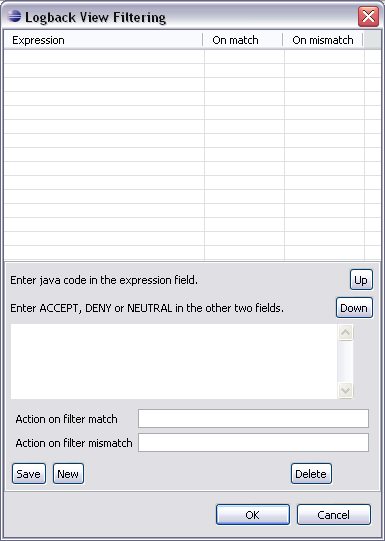
The upper part of the window lists the filters that are currently used by the logback plugin. The lower part lets you create, edit or delete a filter.
A filter is composed of three informations. First, a Java expression, that will be evaluated for each logging event that is recieved by the logback plugin. This expression can use a set of common variables such as level, logger, message, and several others. For a complete list of available variables, please refer to the chapter about filters in the logback manual.
The second and third informations that compose a filter are the action that will be taken depending on the result of the evaluation. Three actions are possible: ACCEPT, DENY or NEUTRAL. Setting a filter's reply to ACCEPT or DENY will prevent the plugin from evaluating any other filter and return a definitive result on the logging event.
Let us create a filter that will drop any request that has a level lower than INFO. A click on the New button creates a new filter. Enter the following informations in the corresponding fields:
- Expression:
level >= INFO - Action on filter match:
NEUTRAL - Action on filter mismatch:
DENY
Here is what the window should look like, once you've saved the filter.
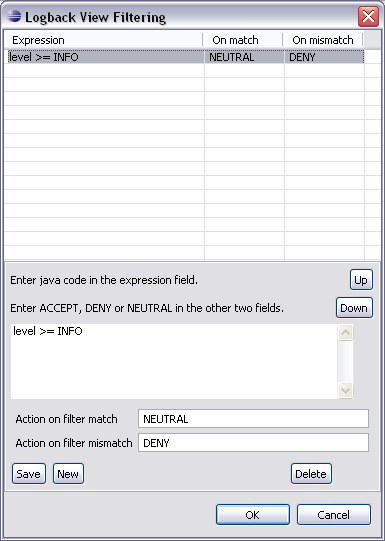
We've just created a filter that will drop any requests whose level is lower than INFO. Note the use of the NEUTRAL value as the action to be taken when the filter is matched. Since we do not know what other filters might want to do, there is not reason to stop evaluating when the level is higher or equal to INFO.
You may have noticed the two buttons on the left side of the filter windows labelled Up and Down. An important concept ruling the filters in logback is that filters are called in a chain. As we've seen above, a filter returning ACCEPT or DENY will stop the chain and have a direct impact on the logging event. It is sometimes important to manage the order in which filters are called to achieve a specific filtering policy.
You should now be ready to experience the logback plugin and use its functionnalites. If you have any question about its use, feel free to use the logback mailing lists.
'IT-Consultant' 카테고리의 다른 글
| Nutch 0.9 를 이용하여 한글 검색하기. (0) | 2009.04.10 |
|---|---|
| Nutch crawling (0) | 2009.04.10 |
| padding:3px 4px 3px;의 의미는? (0) | 2009.04.09 |
| ORACLE TEXT 10G의 수동 설치와, 설치 해제 방법 (0) | 2009.04.09 |
| findlinks에서 호출되는 곳. (0) | 2009.04.09 |